Come fare: Cambiare il tipo di grafico di un report personalizzato
Puoi cambiare il tipo di grafico visualizzato in un rapporto:
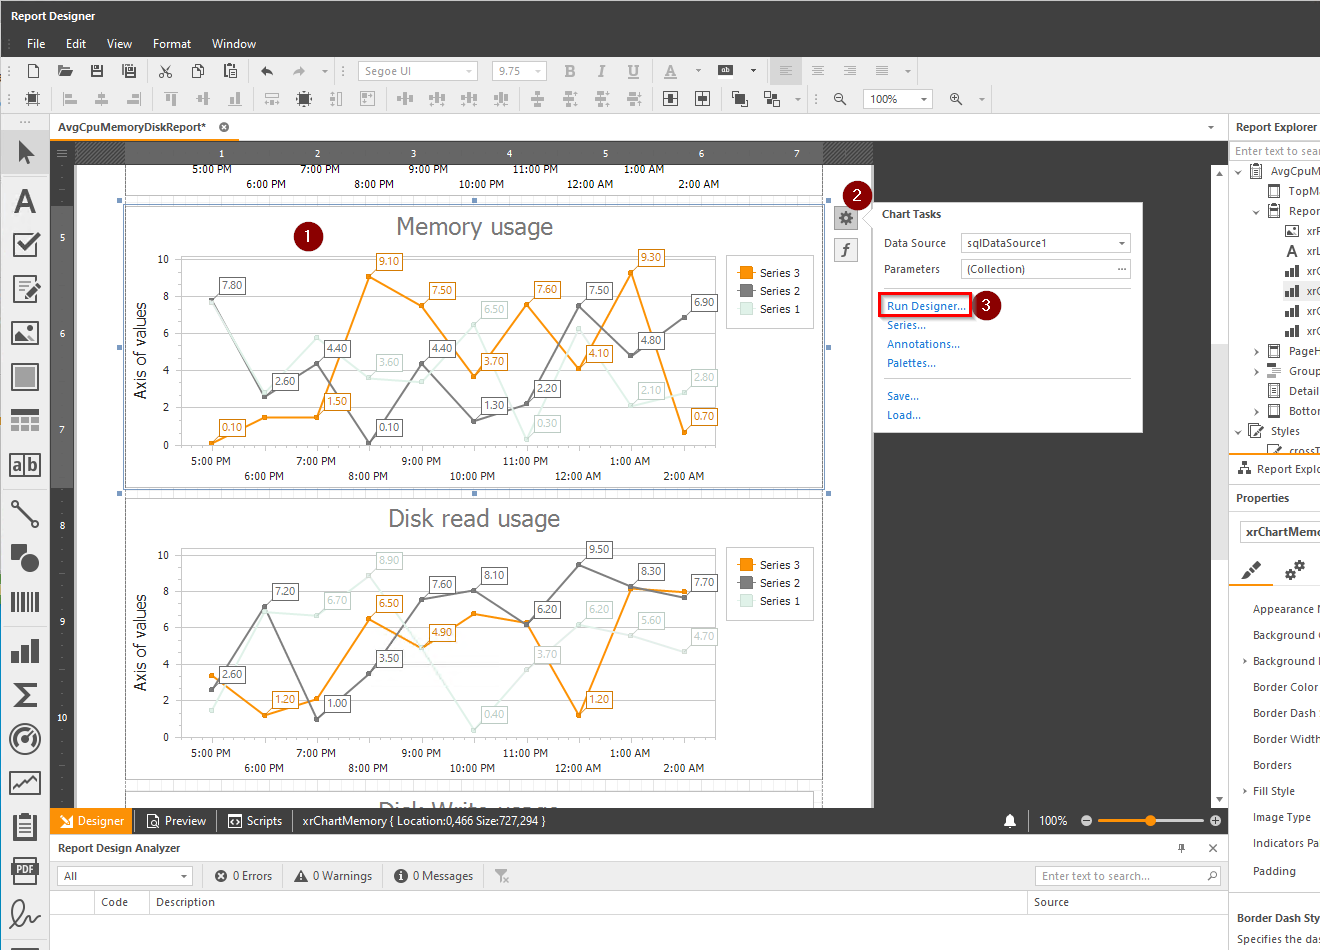
Prima seleziona il grafico che desideri modificare, quindi fai clic su il impostazioni pulsante, e fai clic su Esegui designer :

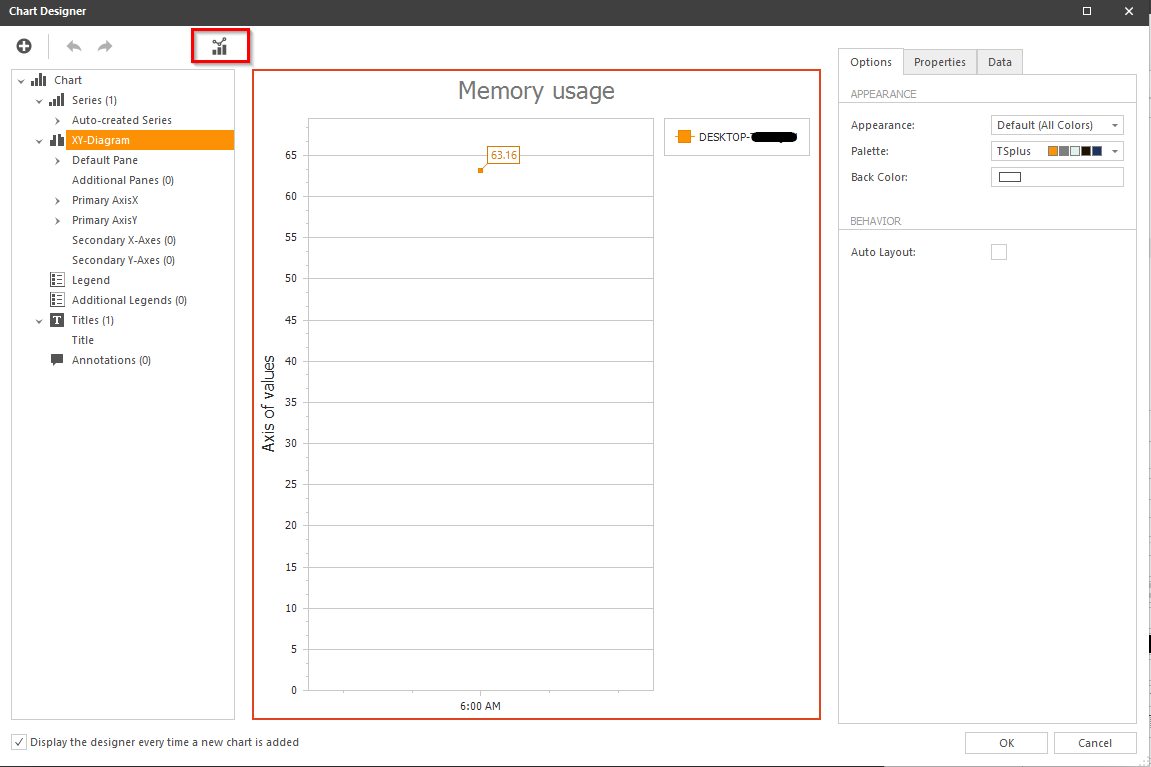
Poi fai clic sul pulsante "Cambia tipo":

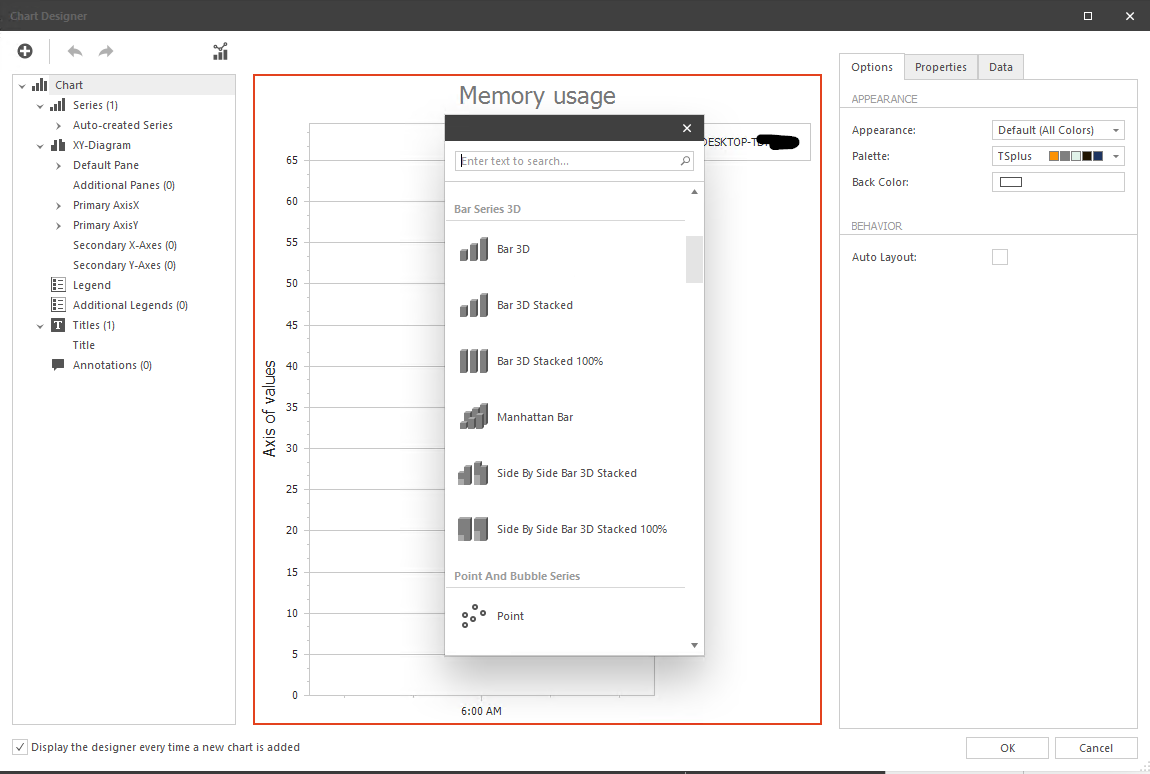
Scegli il nuovo tipo:

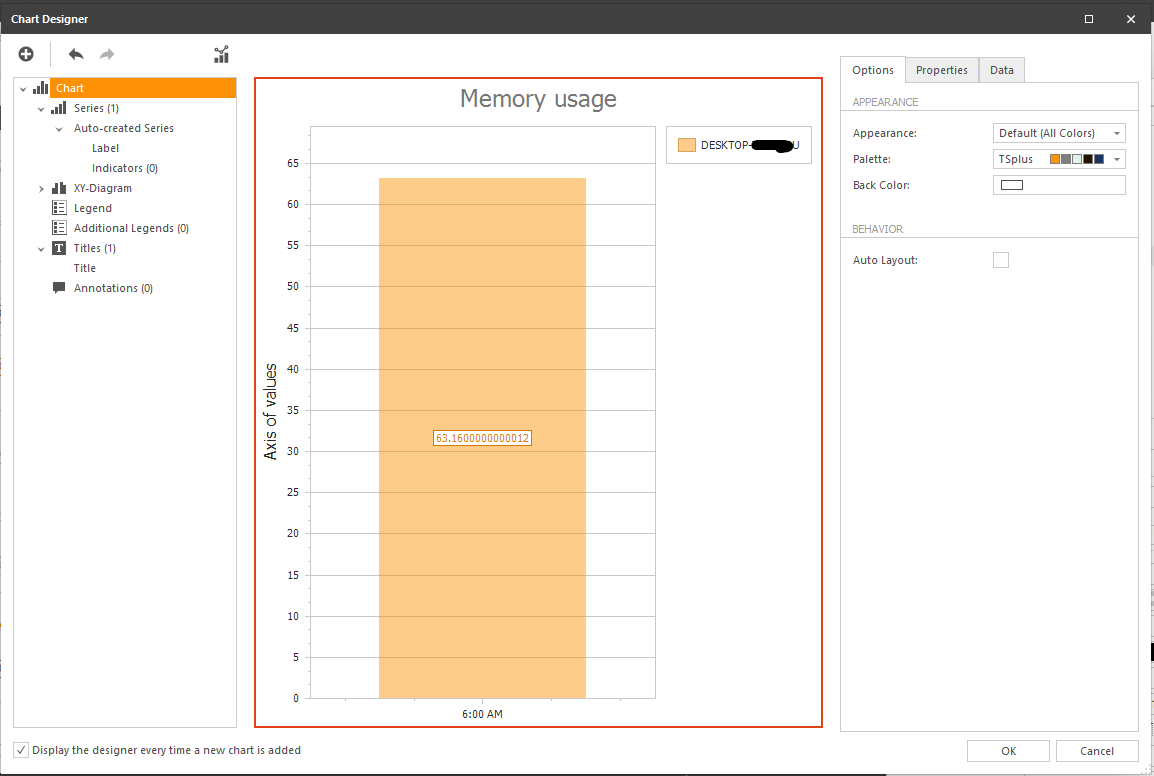
Clicca su OK e guarda le modifiche applicate:

Puoi anche, in questo modulo, personalizzare il contenuto del grafico (titolo, legenda, annotazioni, ecc.)